


How do you graph $y = \cos x + 3$?
Answer
546k+ views
Hint: In order to graph the above trigonometric function, first draw the graph of the cosine function. Use the fact that there is a number in the end of cosine function, then there will always be a Vertical shift. If the number is positive, then Vertical Shift Up Else Vertical Shift Down. In our case the number is 3 so there is a Vertical Shift Up three unit.
Complete step by step answer:
We are given a trigonometric function i.e. $y = \cos x + 3$
Recall that the domain of cosine function is in the interval $\left[ {0,\pi } \right]$ and the range of the same is in the interval $\left[ { - 1,1} \right]$.
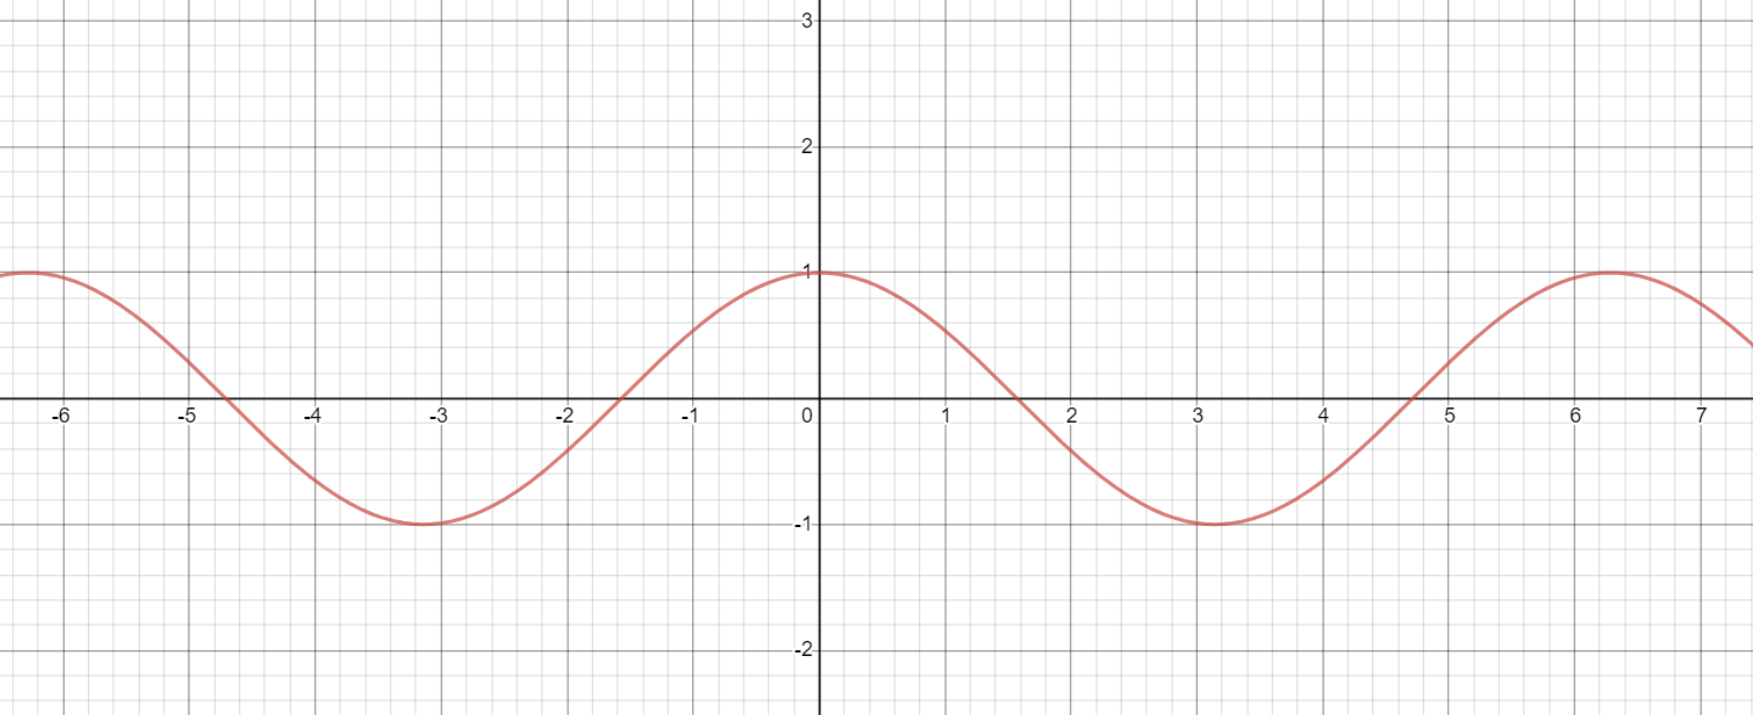
Lets first draw the graph of cosine function $y = \cos x$
If you add any number on the end of the cosine function, then there will always be a vertical shift of the graph. When the number is positive then there will be a vertical Shift up and if the number is negative then Vertical shift down.
In our case, the number is positive i.e. $3$ so the graph will have a Vertical Shift Up three units, which gives the following graph :
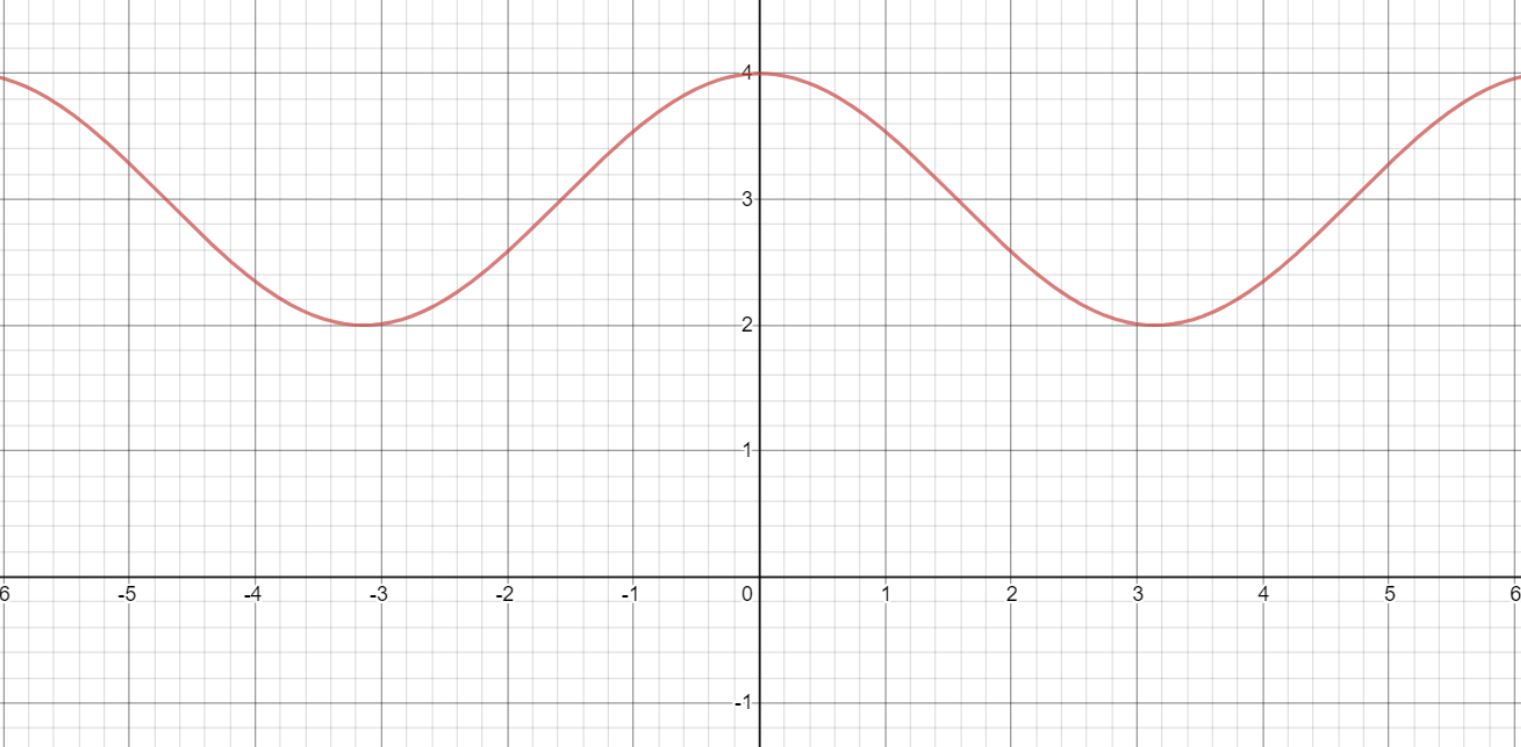
Hence, we’ve successfully plotted our graph of equation$y = \cos x + 3$
Note: 1.Draw the cartesian plane only with the help of straight ruler and pencil to get the perfect and accurate results.
2.Mark the points carefully.
3. x-intercept is the point at which the line intersects the x-axis of the plane and similarly y-intercept is the point at which line intersects the y-axis of the plane.
Complete step by step answer:
We are given a trigonometric function i.e. $y = \cos x + 3$
Recall that the domain of cosine function is in the interval $\left[ {0,\pi } \right]$ and the range of the same is in the interval $\left[ { - 1,1} \right]$.
Lets first draw the graph of cosine function $y = \cos x$
If you add any number on the end of the cosine function, then there will always be a vertical shift of the graph. When the number is positive then there will be a vertical Shift up and if the number is negative then Vertical shift down.
In our case, the number is positive i.e. $3$ so the graph will have a Vertical Shift Up three units, which gives the following graph :
Hence, we’ve successfully plotted our graph of equation$y = \cos x + 3$
Note: 1.Draw the cartesian plane only with the help of straight ruler and pencil to get the perfect and accurate results.
2.Mark the points carefully.
3. x-intercept is the point at which the line intersects the x-axis of the plane and similarly y-intercept is the point at which line intersects the y-axis of the plane.
Recently Updated Pages
Master Class 11 Computer Science: Engaging Questions & Answers for Success
Master Class 11 Business Studies: Engaging Questions & Answers for Success
Master Class 11 Economics: Engaging Questions & Answers for Success
Master Class 11 English: Engaging Questions & Answers for Success
Master Class 11 Maths: Engaging Questions & Answers for Success
Master Class 11 Biology: Engaging Questions & Answers for Success
Trending doubts
One Metric ton is equal to kg A 10000 B 1000 C 100 class 11 physics CBSE
There are 720 permutations of the digits 1 2 3 4 5 class 11 maths CBSE
Discuss the various forms of bacteria class 11 biology CBSE
Draw a diagram of a plant cell and label at least eight class 11 biology CBSE
State the laws of reflection of light
Explain zero factorial class 11 maths CBSE